
The latest update from the ONS Covid-19 infection survey was published yesterday. Previous updates on this are covered in my previous blog on the subject.
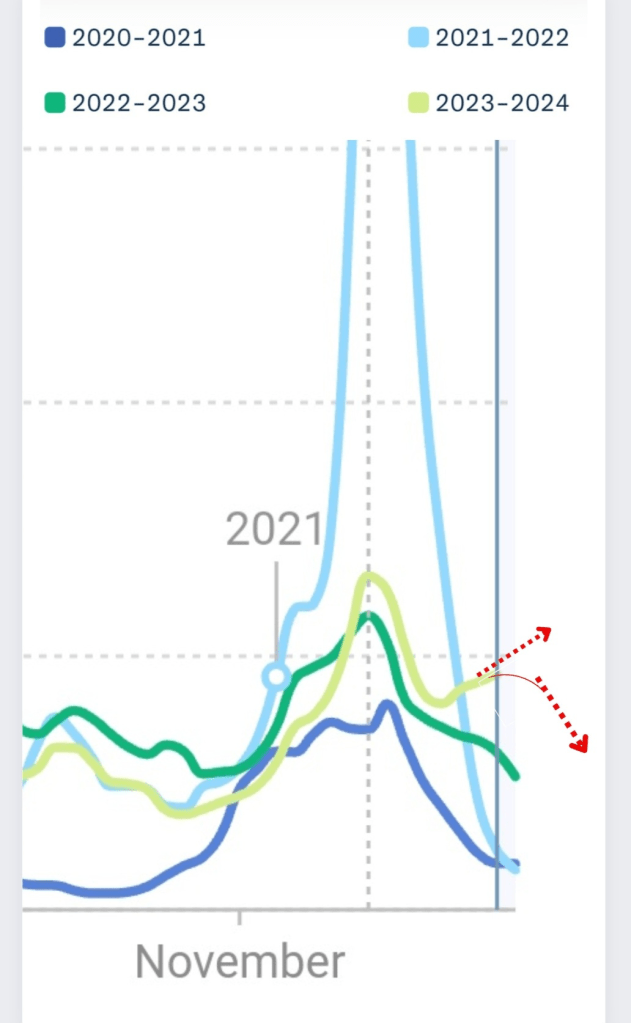
Whilst the two previous updates published last month suggest there has been a fall in the prevalence of infections since mid December, yesterdays update on data relating to the week ending 24 January suggest a levelling off in the fall with signs of a possible uptick in infections. This is illustrated in the following graph.
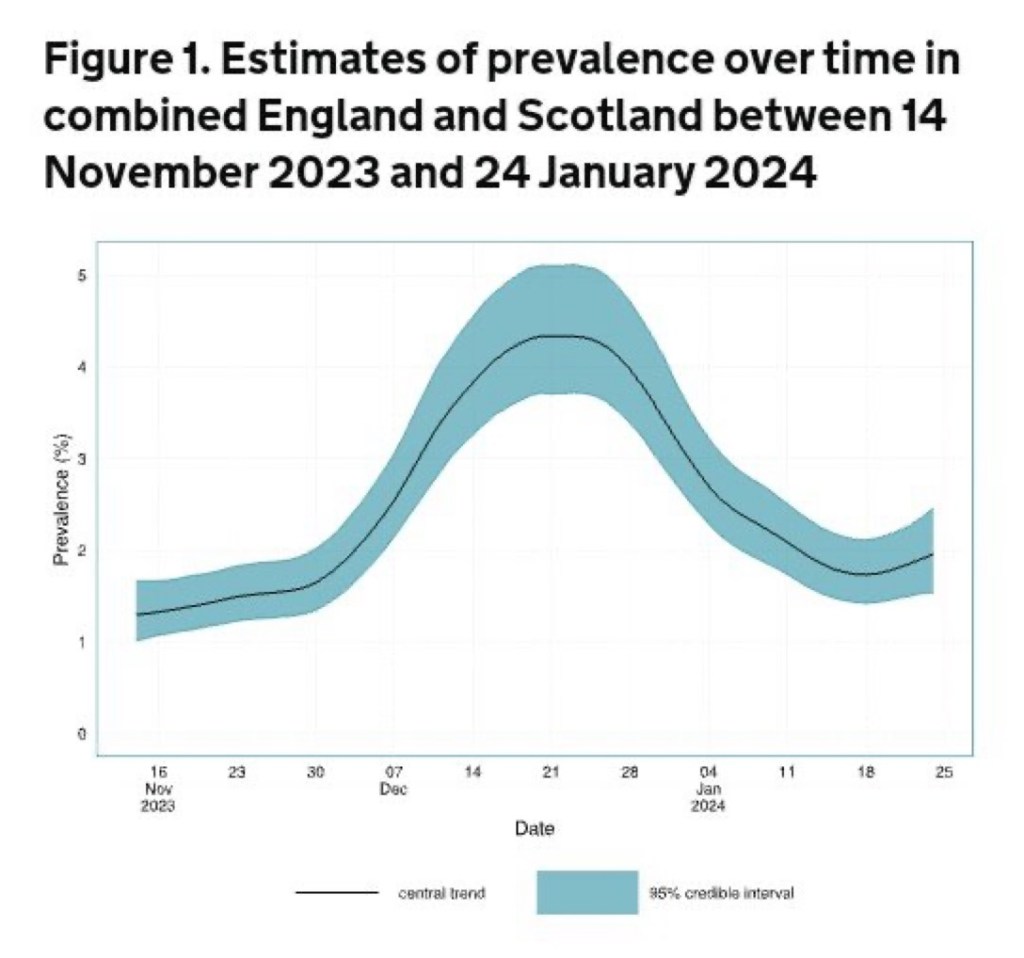
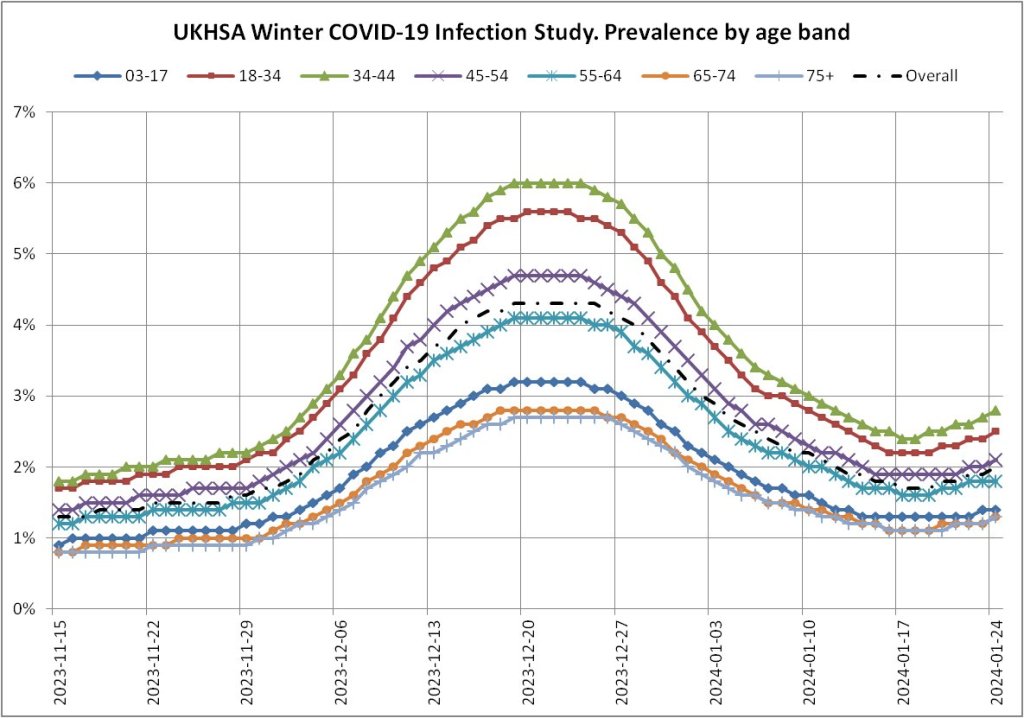
This trend is remarkably similar across England, Scotland and the English regions. Similarly there are no significant diverging trends to report when we look at infections across age groups – see graph below.
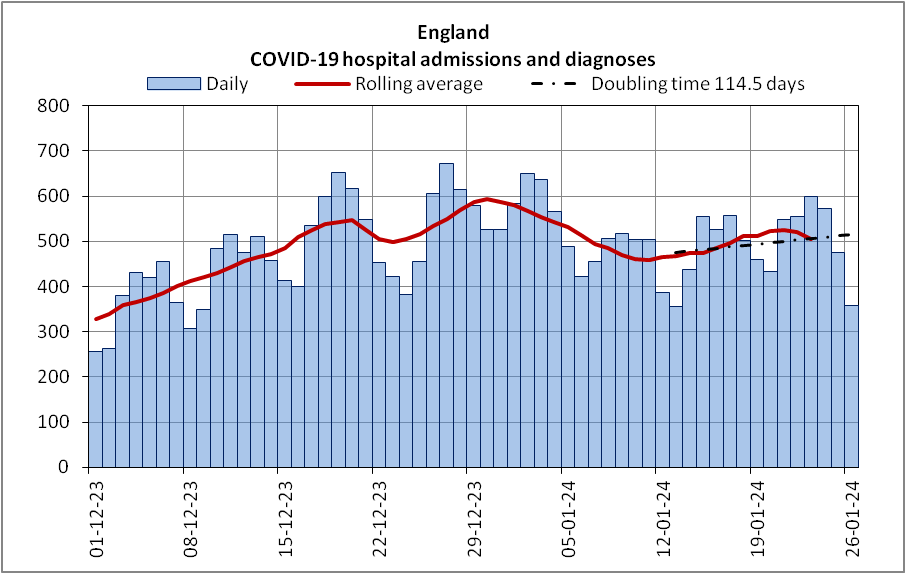
Hospital Admissions
Hospital admissions and diagnoses with Covid-19 in England also show signs of a slight uptick.
Concluding Comments
As will be clear from my previous blogs on the subject, I have significant doubts about the robustness of both the Winter Covid-19 infections survey and the hospital admissions data following the ending of routine testing of hospital patients for Covid-19 in spring 2023. (I hope to produce a blog on hospital admissions data shortly).
It is therefore very difficult to judge whether the trends reported above are real and whether they will be sustained. The next update from the Winter ONS Covid-19 infections survey will be on 15 February and I will update this blog accordingly in due course.
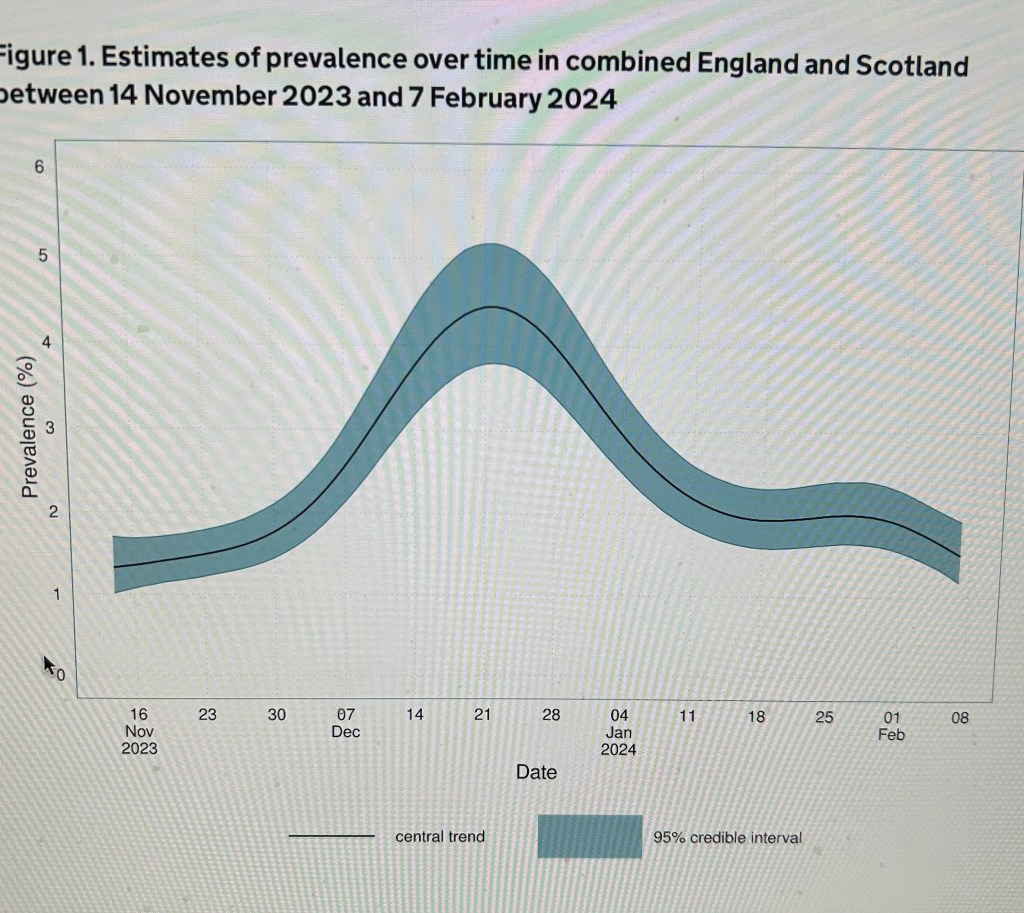
15 February Update
The results from the survey up to 7 February published today show very little change from the picture to emerge from the 1 February release. There may be signs of a slight downturn in prevalence but it is not entirely clear at this stage. This is somewhat disappointing because prevalence remains pretty high as we move towards the end of winter.
Interlude from the USA
The next update from the Winter Covid-19 infections survey is due on Thursday 29 February.
In the meantime it is worth noting a couple of concerning developments based on wastewater analysis in the USA.
Firstly, analysis done by the well respected subscription only T.A.C.T. ( Together Against Covid Transmission) suggests that after a surge in December Covid-19 in the form of the JN.1 and its sub variants may be taking off again.
The data from the two national wastewater reporting sites paints a concerning picture: overall prevalence of the virus remains high across the U.S., with many areas experiencing a rise in prevalence.
TACT
And
Zooming in for a closer look, below, it becomes evident that even if prevalence were to start declining, we would remain significantly above typical levels for this time of year for the next month or two. However, the concerning reality is that prevalence is actually on the rise in many areas, indicating that we are undeniably navigating uncharted territory.
TACT
Analysis of the evolution of the JN.1 variant that caused the December surge suggests :
JN.1.4 has an estimated growth advantage of 32% over JN.1. JN.1.11.1 has an estimated 70% growth advantage over JN.1. JN.1.23 has an estimated 67% growth advantage over JN.1.
JN.1.23’s combination of increased immune escape and ACE-2 binding may make it more dangerous than JN.1.11.1 but not necessarily more transmissible. The evolutionary track is what should be most concerning to everyone. JN.1.11.1 is already adding new mutations which may make it more dangerous than JN.1.23, but it is too early to say for sure.
T.A.C.T.
Secondly, also from T.A.C.T. is a discussion of why the convergence of Covid-19 and a surge in measles presents a particular challenge, concluding that:
Similar to COVID-19, heightened transmission rates increase the risk of virus evolution, potentially evading vaccines through persistent infections. Both diseases harm the immune system, with measles even erasing immunity to other pathogens. This dangerous combination of highly contagious airborne viruses demands attention.
TACT
Update 29 February 2024
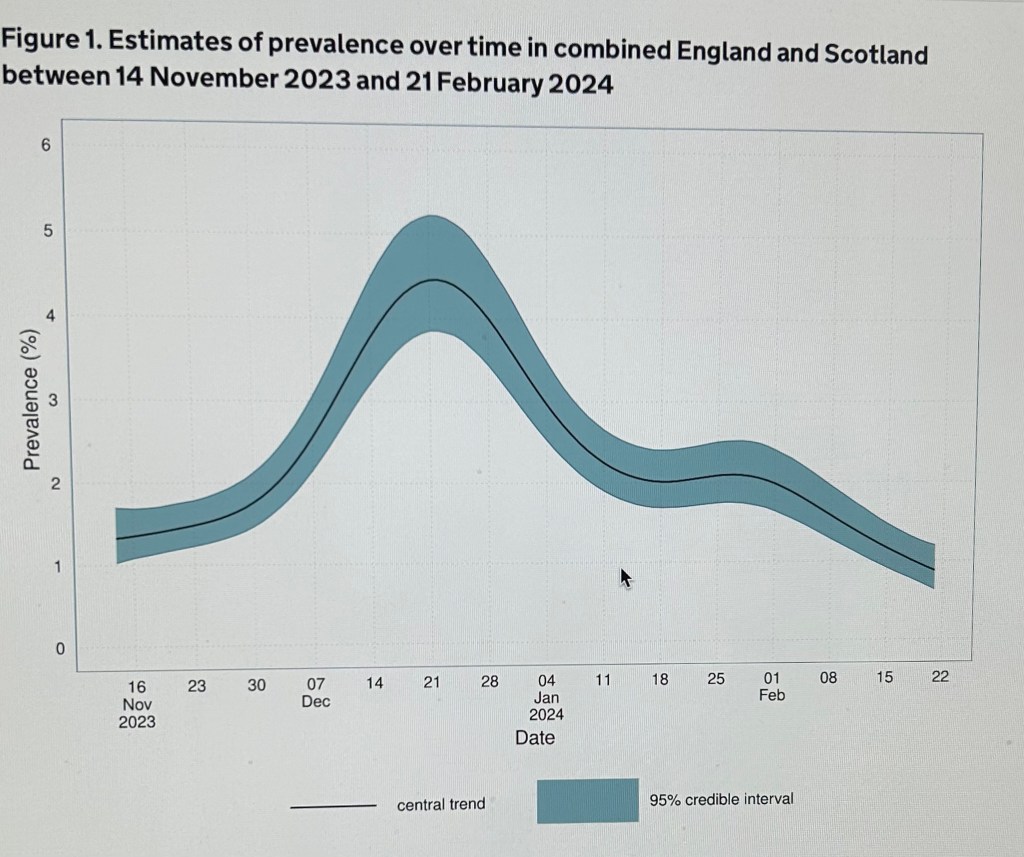
The latests results from the ONS Winter Covid Infections survey published today suggest there has been a fall in the number of people across England and Scotland who are infected with Covid-19. This is consistent across all regions and age groups, with the lowest rate of infection amongst those over 75.
There has also been a sharp fall in the number of hospitalisations with Covid-19.
We will update this blog with the next update from UKHSA in two weeks time. In the meantime here is an update on the current numbers from Christina Pagel.
Of course there is concern about what is happening in the USA where wastewater levels suggest some states are entering another wave of Covid-19.
Mid March update
The Winter Infection survey is being terminated early and UKHSA has not given any reason for this. The update published on 14 will be the last in the series. This shows a broadly stable picture up until 6 March with no notable differences in trends between regions or age groups.
Has the UK hit the bottom of the wave and will cases start to go up? We don’t know.
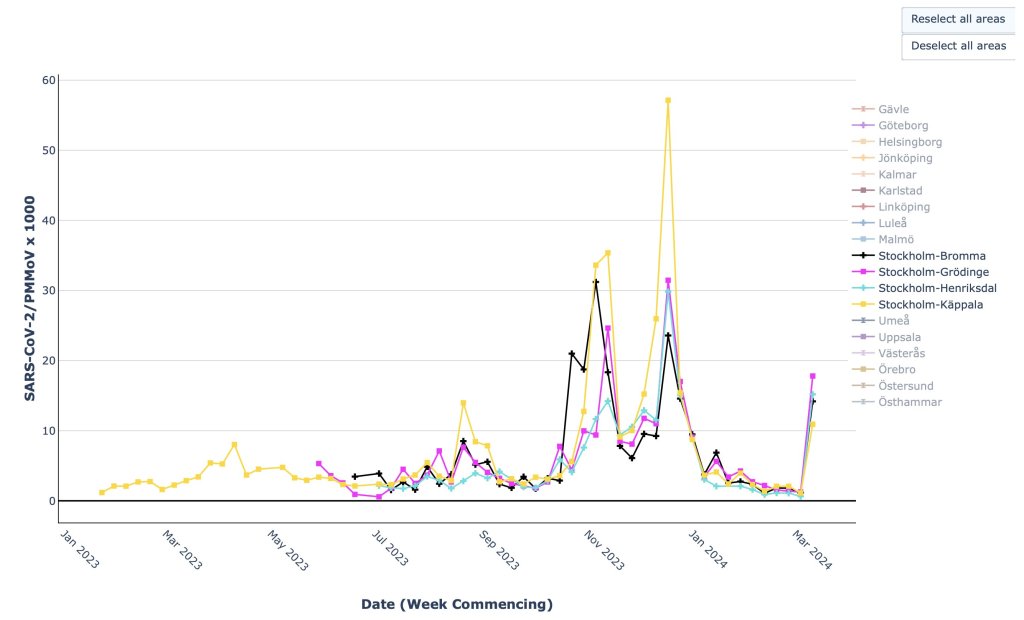
Meanwhile, something is happening in Sweden on the basis of their wastewater analysis. The saga goes on…
Concluding Comments
The ONS Covid-19 winter infections survey has ended and hospitalisation data (which is itself increasingly inaccurate due to lack of testing in hospitals) will no longer be published weekly – from the end of March will only be published monthly.
Unlike the USA and most other western countries we no longer have any wastewater analysis data. In effect we will be flying almost completely blind and will need to rely on indications from abroad and guess about what is happening in this country. I and many others are very concerned about this and need to be on standby to mount a campaign to put pressure on decision makers as necessary over the coming months.

Leave a comment