On Thursday 10 October the UKHSA announced plans for a series of weekly updated graphs about so called ‘winter viruses’, based on data that is already available. So far so good – there is nothing wrong with presenting data more clearly in graphic form.
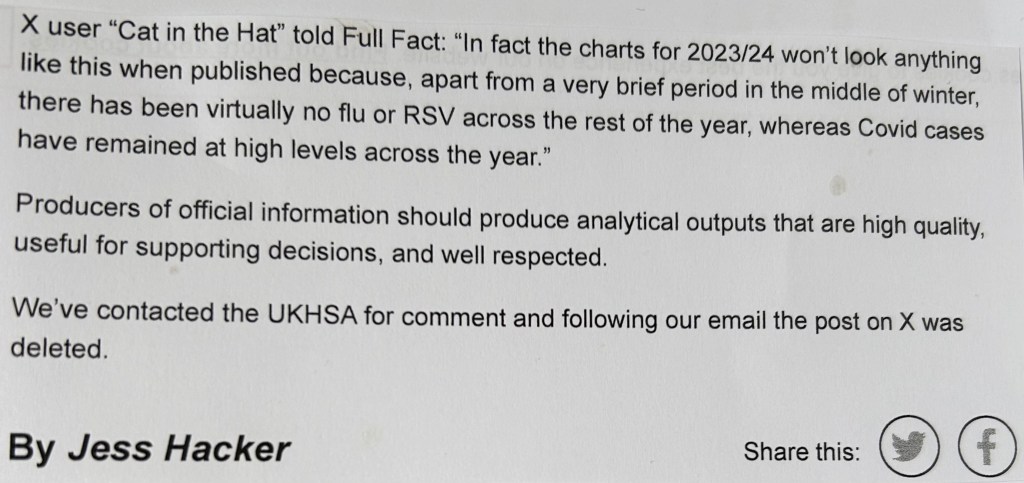
Except it was not OK. The post has now been removed but a number of people were able to take a screen shot of the summary which I have reprinted below.

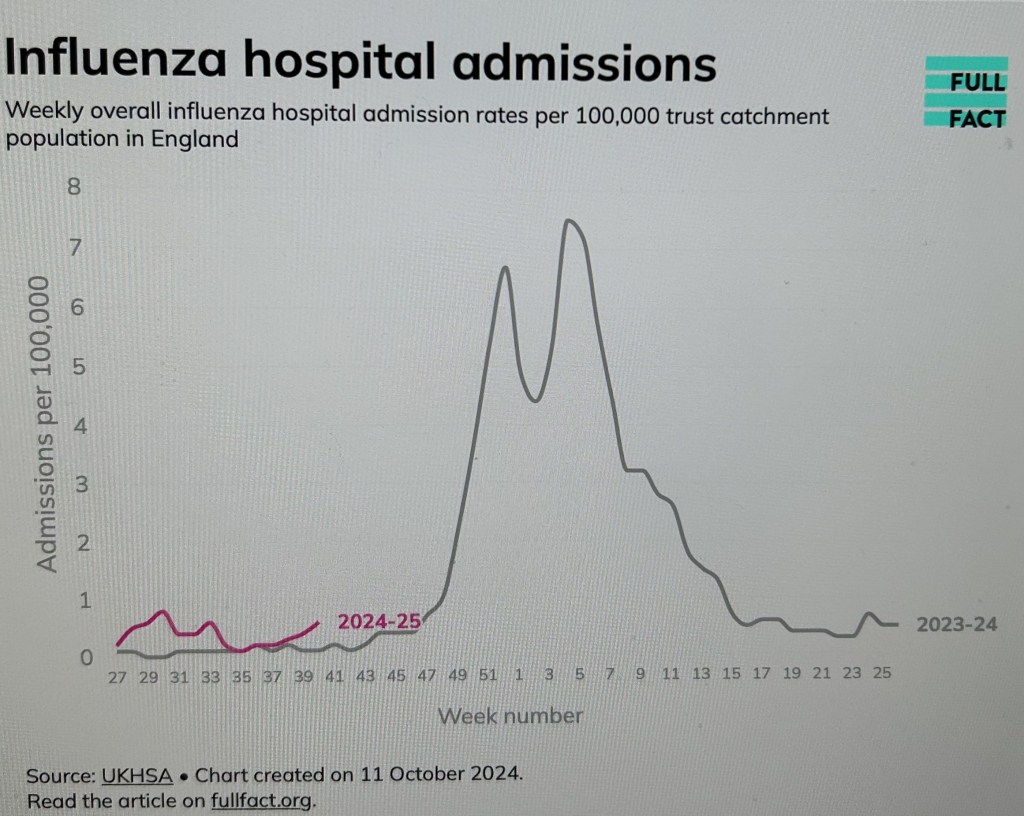
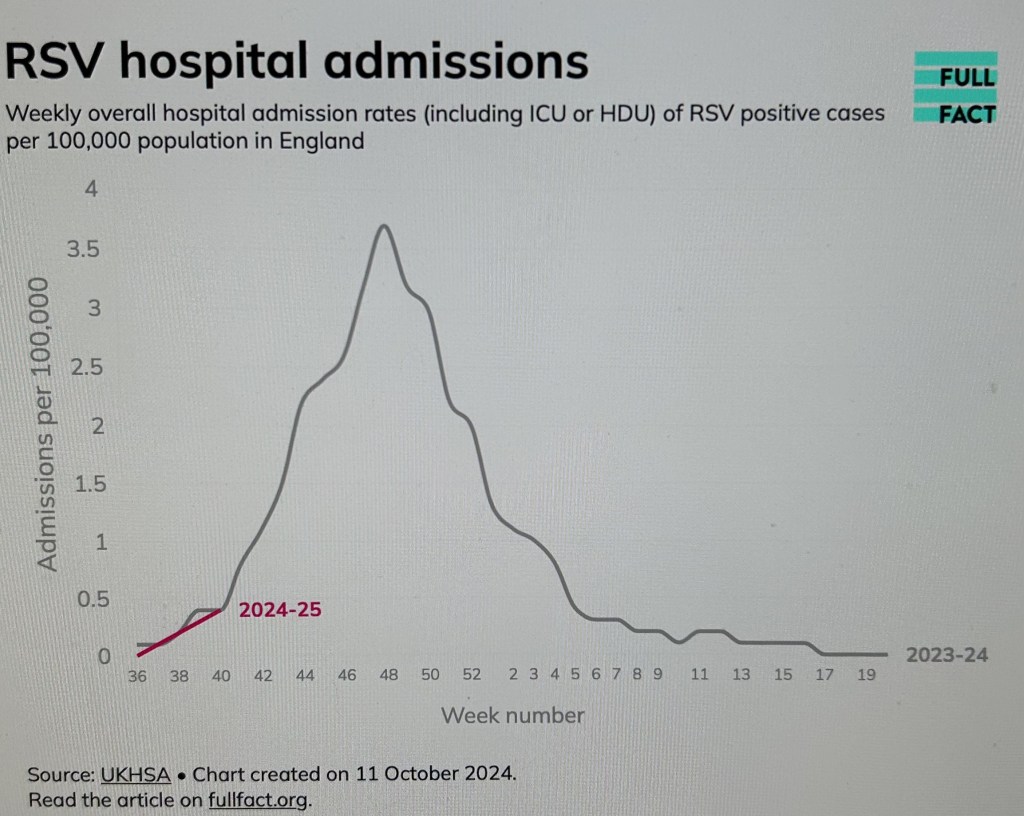
The problem was that the pattern of the graphs did not resemble anything that anyone in the Covid analytical community recognised. And we were right. Rather than using real data, the UKHSA made some up and put it into three graphs!
Once alerted, the fact checking organisation Full Fact moved fast and issued their response on Friday. I have reproduced this below:


Implications
Regular readers of this website will not be surprised by any of this as it is not the first time that UKHSA have done something similar. And this is far from being a storm in a teacup dispute between statisticians. The fact is that the UKHSA has over the past few years sought to minimise the impacts of Covid-19 and have regularly tried to present it as a stable winter virus – much like the flu.
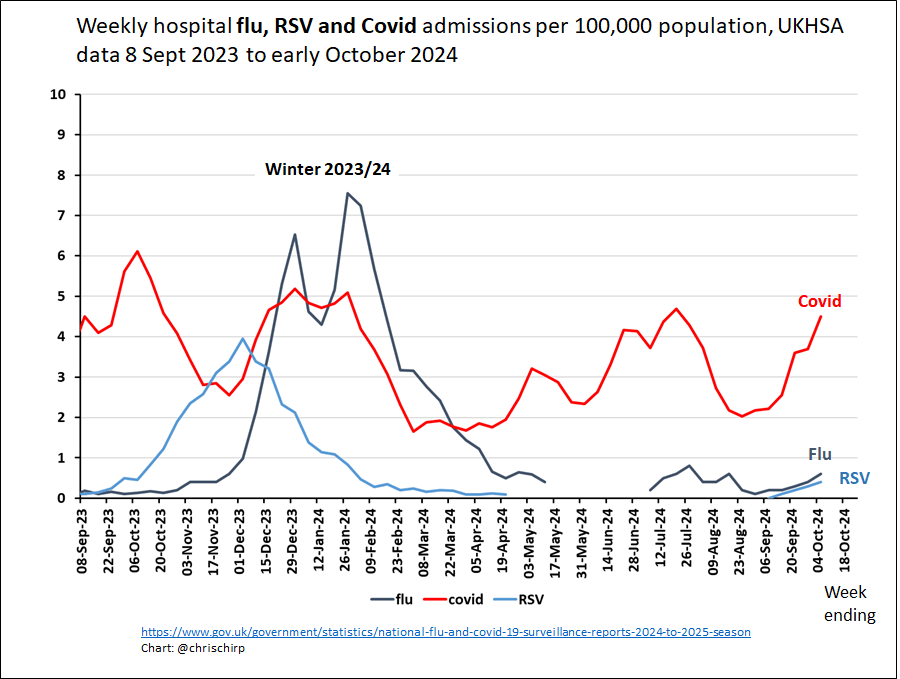
Yet it must surely be evident to anyone, particularly if you look at the helpful graph compiled by Christina Pagel at the top of this blog, that Covid-19 is far from being a stable winter virus like flu. It is mutating at breakneck speed, it is at least 3 times more transmissible than the worse flu virus, rates are high all year round, and the UK is currently in the 5th wave of the year.
This is important to everyone, but accurate timely data is particularly important to the clinically vulnerable families community who need to avoid catching viruses. Moreover, given how many of us have not responded to the vaccines, and given the damage that can be done by Covid, we need to be particularly careful to dodge Covid-19.
Yet it is far easier to avoid catching flu or RSV because there are only a few days/weeks where influenza and RSV are widespread and outpace Covid-19. It is relatively easy for us to take care in these periods and is it also the case that vaccines are more effective in preventing the spread of these illnesses that are significantly less transmissible.
Covid-19 is a completely different matter. Vaccines are not particularly effective at preventing transmission and rates of infection tend to be high all year round. Moreover, since the termination of the ONS Infection Survey and all wastewater analysis we have few clues about when risks are high. Waiting for this to show up in flawed and time-lagged hospital admissions and deaths data (the above graphs) is next door to useless given the speed at which the picture changes.
As will be evidence, many of us are in despair about UKHSA and how they can continue to be allowed to be responsible for official statistics on Covid-19. The latest incident will have caused even more people to lose all confidence in them. However, the best we can do is watch them like a hawk and call out their mistakes. There are a large number of statistically literate people doing just this all year round!
Gillian Smith, 12 October 2024

Leave a comment