Summary

The way the Office for National Statistics (ONS) measures the number of excess deaths has never attracted much controversy before. The current method is relatively simple to understand and although far from perfect, it is a very easy task to explain the potential problems. It has proved particularly useful during the pandemic as a way of monitoring how many excess deaths we have been seeing since Covid-19 struck.
However, on 21 February 2024 ONS announced that the measure would be changing in order to address the weaknesses of the current method. Alarm bells began to ring loudly across social media when it became clear that the results of the change would be to reduce the number of excess deaths in the so called government ‘post pandemic’ year 2023 from circa 31,000 to circa 11,000. Those interested in Long Covid are expressing particular alarm that it is an attempt to airbrush Covid and Long Covid from view and some critics have gone as far as claiming that the UK is only one step away from a North Korean approach to public statistics! This blog attempts to explain the issues, raising some serious concerns.
Background
The number of excess deaths has until recently been based on the number of actual deaths over a given period compared with the number of deaths one would have expected using an average of the previous 5 years as the baseline. So, for example, in a particularly bad year for flu one can see how many more deaths were occurring over and above what one would expect (eg the average over the last 5 years).
The method had limitations because the baseline does not take account of the changing characteristics of the population, including increased migration and population ageing. So for example, in theory we would expect the latter to deflate the number of excess deaths because if more old people (who are more likely to die) are included in the 5 year moving baseline, the excess deaths over and above the baseline will be lower.
However, in reality, population changes are fairly gradual, at least at the national level, and the figures produced are generally regarded as in the right ballpark. For example, in the UK the winter of 2015 was a bad flu season and we can see this in the excess death figures – there were 36,836 excess deaths in 2015 compared to 6,542 in 2014 (see first column of table 1 below).
The Impact of the Pandemic
When the pandemic struck in March 2020 the excess deaths figure proved to be very useful in assessing how many people were dying over and above what one would have expected anyway. This information was particularly useful in countering claims that the people dying of covid were all old and would have died anyway. The data actually showed that there were over 84,000 excess deaths in 2020.
Thereafter there was an obvious problem in calculating excess deaths based on a 5 year moving average because the number of deaths in 2020 was so high. ONS dealt with this by removing 2020 from the baseline so that excess deaths in 2021 were calculated using a 2015-2019 average. ONS estimates (using current method) suggest there were 61,907 excess deaths in 2021.
Then in 2022 they used a baseline including 2016-2019 plus 2021 and estimated the number of excess deaths to be 38,960.
In 2023 the baseline was calculated using a moving average of 2017 – 2019 plus 2021, and 2022. The number of excess deaths remained high at an estimated 31,442. Some people might have been surprised by this but not expert commentators interested in Long Covid or in the impacts of the state of the NHS in terms of identifying and treating disease.
New Methodology
Early in 2023 ONS, in conjunction with the devolved administrations and the UKHSA (UK Heath and Security Agency) launched a low key review into the method for calculating excess deaths. This review concluded with the publication of details of a new methodology for calculating excess deaths. ONS did not pre announce this publication and chose to release it on Tuesday 22 February 2024 in the same week that the mini TV drama Breathtaking was airing and several prominent studies on the impact of Covid-19 infections on the brain were published.
The stated rationale for the change is that the previous method – the 5 year moving average – fails to take account of changing demographics – including population ageing, and regional trends. ONS argue that the method needs to be more sophisticated and designed to measure new threats rather than existing problems such as Long Covid.
There are two key problems here. Firstly, ONS published illustrative data showing the difference between the estimate of excess deaths under the new method compared with the current method and this reveals some dramatic differences – for example, in 2016 the current method estimated 23,036 excess deaths whereas the new method estimates 941, and in 2019 the current estimate is 6,006 excess deaths whereas the new estimate is minus 38,973 deaths ie fewer deaths than one would have expected.
| Year | Current method | New method | New method, lower 95% confidence limit | New method, upper 95% confidence limit |
|---|---|---|---|---|
| 2011 | -17,346 | -8,827 | -14,674 | -2,979 |
| 2012 | 3,444 | 10,020 | 5,945 | 14,094 |
| 2013 | 12,011 | 22,206 | 15,932 | 28,480 |
| 2014 | 6,542 | 1,587 | -247 | 3,421 |
| 2015 | 36,836 | 30,858 | 27,471 | 34,244 |
| 2016 | 23,036 | 941 | -579 | 2,460 |
| 2017 | 24,000 | 2,925 | -2,337 | 8,187 |
| 2018 | 25,224 | 522 | -1,771 | 2,814 |
| 2019 | 6,006 | -34,408 | -38,973 | -29,843 |
Source: Office for National Statistics
The issue is thrown further into focus when we look at the pandemic years. As we can see from the table below, in 2020 and 2021 the differences between the two methods are not dramatically different and in 2022 the new method suggests the number of excess deaths was higher than under the current method. However, the real controversy comes with the 2023 figures. The current method suggests the number of excess deaths was 31,442 whereas the new method suggests a fall to 10,994 excess deaths.
Table 2 Excess Deaths 2020 – 2023
| Year | Current method | New method | New method, lower 95% confidence limit | New method, upper 95% confidence limit |
|---|---|---|---|---|
| 2020 | 84,064 | 76,412 | 72,453 | 80,371 |
| 2021 | 61,907 | 55,079 | 48,172 | 61,987 |
| 2022 | 38,960 | 43,456 | 32,124 | 54,789 |
| 2023 | 31,442 | 10,994 | 8,719 | 13,269 |
This has sparked a huge amount of interest because 2023 was marked by a very bad flu season, a high number of Covid deaths, albeit lower than during the peak of the pandemic, increasing concerns about the number of people having strokes and heart attacks sometimes explained by Long Covid, significant ambulance and A and E delays and an NHS that is generally regarded as being in crisis. Therefore how can there have been only half the number of excess deaths as in 2013 for instance? It does not make sense and ONS have not really tried to explain it in real world terms.
On top of concerns about the rather strange results, the second key concern is the lack of transparency about the details of the methodology used to calculate the new estimates of excess deaths. The beauty of the old method was its transparency and simplicity. Anyone with the time could go to the raw data and calculate the workings behind the estimates of excess deaths. The new method is completely different and based on complex modelling. The following is an example of what has been published in the main ONS overview paper:

Commentary
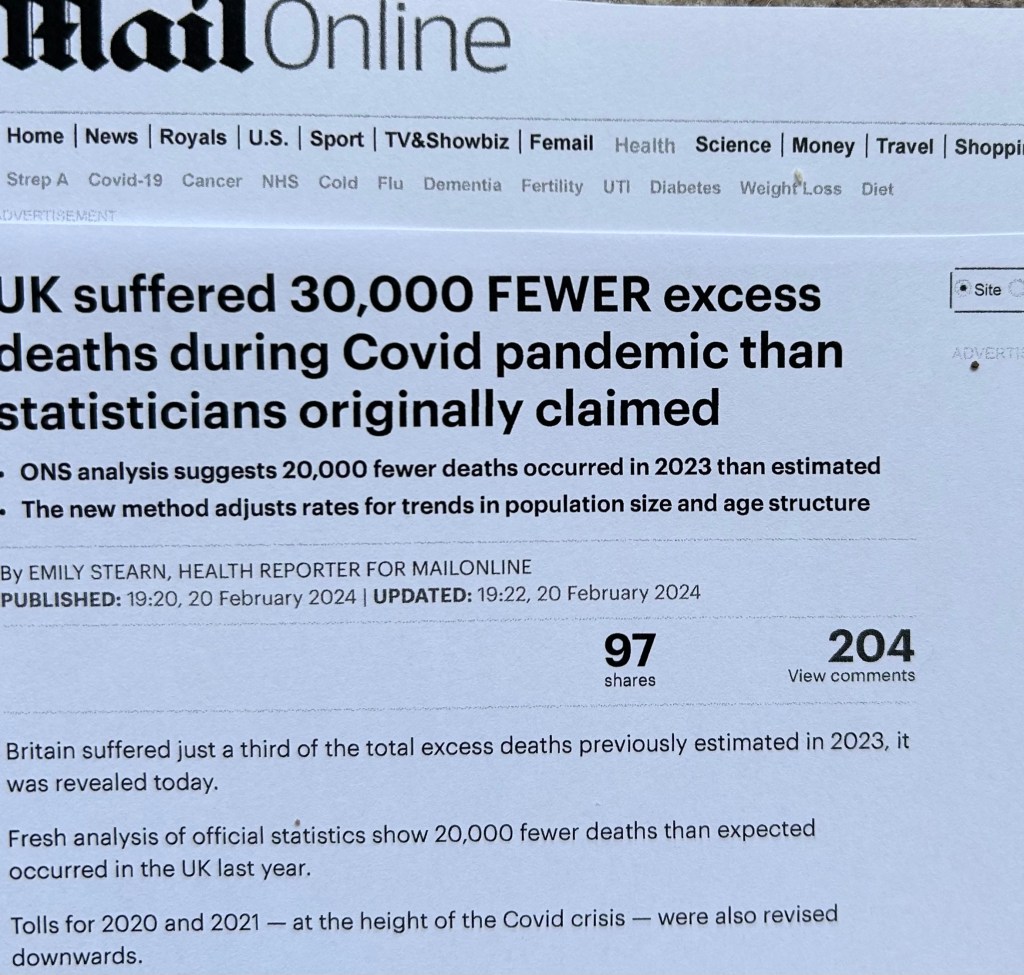
The story was picked up by a number of Newspapers including the Daily Mail which adopted its usual line of trying to downplay the seriousness of the pandemic..
The Daily Telegraph took a similar minimising line in the headline but then went on to quote one of the academics that have raised serious concerns about the new methodology.

It is to the credit of the Telegraph that they quoted Professor Carl Heneghan, the Director of the Oxford Centre for Evidence Based Medicine who said:
It is clear to us that something is not right. There have been more deaths than expected since the pandemic.
Last year the British Heart Foundation reported that since the onset of the pandemic, as of June 2023, there have been nearly 100,000 excess deaths in England involving ischaemic heart disease and other cardiovascular diseases.
The number of premature deaths from heart disease soared to a 14 year high in the wake of the pandemic,. Yet the Government appears to lack any appetite for investigating the root causes.
Daily Telegraph 22 February 2024
In addition social media was awash with critical comment some of which was savage and probably unfair. The following screenshot of a spoof video superimposed over the video of the official launch is not untypical.

Then on 28 February 2024 the well regarded BBC Radio 4 programme More or Less discussed the issues (7:40 minutes from start). This is well worth listening to.
The guest commentator was Professor Sir David Spiegelhalter, University of Cambridge and non executive member of the board of the UK Statistics Authority. The conclusions drawn out by the BBC commentator and Sir David can be summarised as follows: We should not expect to see the consequences of Long Covid, the state of the NHS, delays in treatment due to the pandemic from the new method because the baseline has already been adjusted up to reflect the problems that the country’s health is facing.
More recently, on Sunday 3 March the anti vaxers jumped on the bandwagon of heightened interest in excess deaths as reported in the Sunday Telegraph. A group of 21 MP’s led by Andrew Bridgen are claiming that excess deaths are actually due to harm done by the Covid-19 vaccine. This is interesting as on either measure excess deaths were highest in 2020 when there was no vaccine available.

Concluding Comments
This blog has raised some serious issues about the way that excess deaths are calculated. To be fair to ONS they do say that the statistics are to be given a ‘official statistics under development’ label and they may well undertake further work but don’t commit to doing this. My assessment is that it is true that the existing methodology has significant limitations but at least it is transparent and simple to understand. The new methodology probably has some advantages and as ONS are key to point out the estimates will always be just that – estimates. But the loss of transparency is a serious limitation which has engendered a lack of trust amongst some key user groups as well as a number of academics.

In my assessment the timing and handling of this change has been dreadful. Firstly, the timing of the announcement at a point when interest in Long Covid and continuing deaths from Covid related diseases is high was far from ideal. But to announce the change in the midst of the three day period when the TV drama ‘Breathtaking’ was airing is beyond belief in my opinion. This series has, rightly in my view, increased the intensity of the anger felt by the public and certainly by Covid pressure groups and groups representing the bereaved about the governments handling of the pandemic. For ONS to publish a document that appeared, at least to some, to be airbrushing out Covid deaths at the very same time is unacceptable and has caused a great deal of anger.
In terms of the way forward, it is true that estimates of excess deaths will only ever be estimates. A great deal of the angst about this saga would be reduced considerably if the government continued to publish a suite of statistics on Covid and its impact so that excess deaths figures could be presented as one component of a wider set of statistics that focuses on the state of health, not just death. However, in reality, the opposite is happening. More and more datasets are being abolished all the time. As documented elsewhere on this website the hospital admission and death figures are becoming less and less useful as fewer tests for Covid-19 are taking place, and the ONS Winter Covid-19 infection survey which is far inferior methodologically to the previous Infection Survey, will cease to be undertaken later this month. UKHSA are also refusing to publish the data collected as part of the Winter survey on self reported long – covid which means we have no data on the prevalence of Long Covid since March 2023. This is despite the fact that estimates of the prevalence of Long Covid in the USA are going up.
More generally the government seems content to ignore various worrying developments in the UK at present including the increasing death rate of middle aged adults (50 – 64 age group), the increasing number of deaths from cardiovascular disease, the record numbers of potential workers absent on long term sick leave and record levels of absence from schools. These and other developments such as mounting concern about Long Covid, are all screaming out for serious, co-ordinated independent analysis which would attempt to explain what the key inter-linked drivers of what is happening are. This seems particularly important given the loud warnings about Long Covid being sounded by the WHO.
Finally, this latest saga and other recent incidents have brought the reputation of the Office for National Statistics (ONS) into question. My view is that the close working between ONS and UKHSA may have become too close, at least it is perceived to be too close even if in reality there are clear boundaries, and some stronger Chinese walls need to be erected in a bid to make responsibilities clearer and help to restore the reputation of and trust in ONS.
Update Autumn 2024 – We need to look to other, non political sources
The picture is becoming even muddier as fewer and fewer official statistics are collected to base estimates on. Many people are relying less and less on ONS and searching out new sources of data.
The Actuaries Digital Mortality Working Group is one such source which is produced in the main for the Life Insurance Industry. Their latest bulletin covering the first eight months of 2024 suggests that the total mortality was 2% higher than predicted and Covid-19 mortality was 70% higher than predicted. This later figure is unlikely to be a surprise to regular readers given the never ending laxness in mitigations, cuts in access to life saving vaccines and the increasingly unstable nature of what is a year round virus.

Leave a comment